A Public Dissection of a PyTorch Training Step
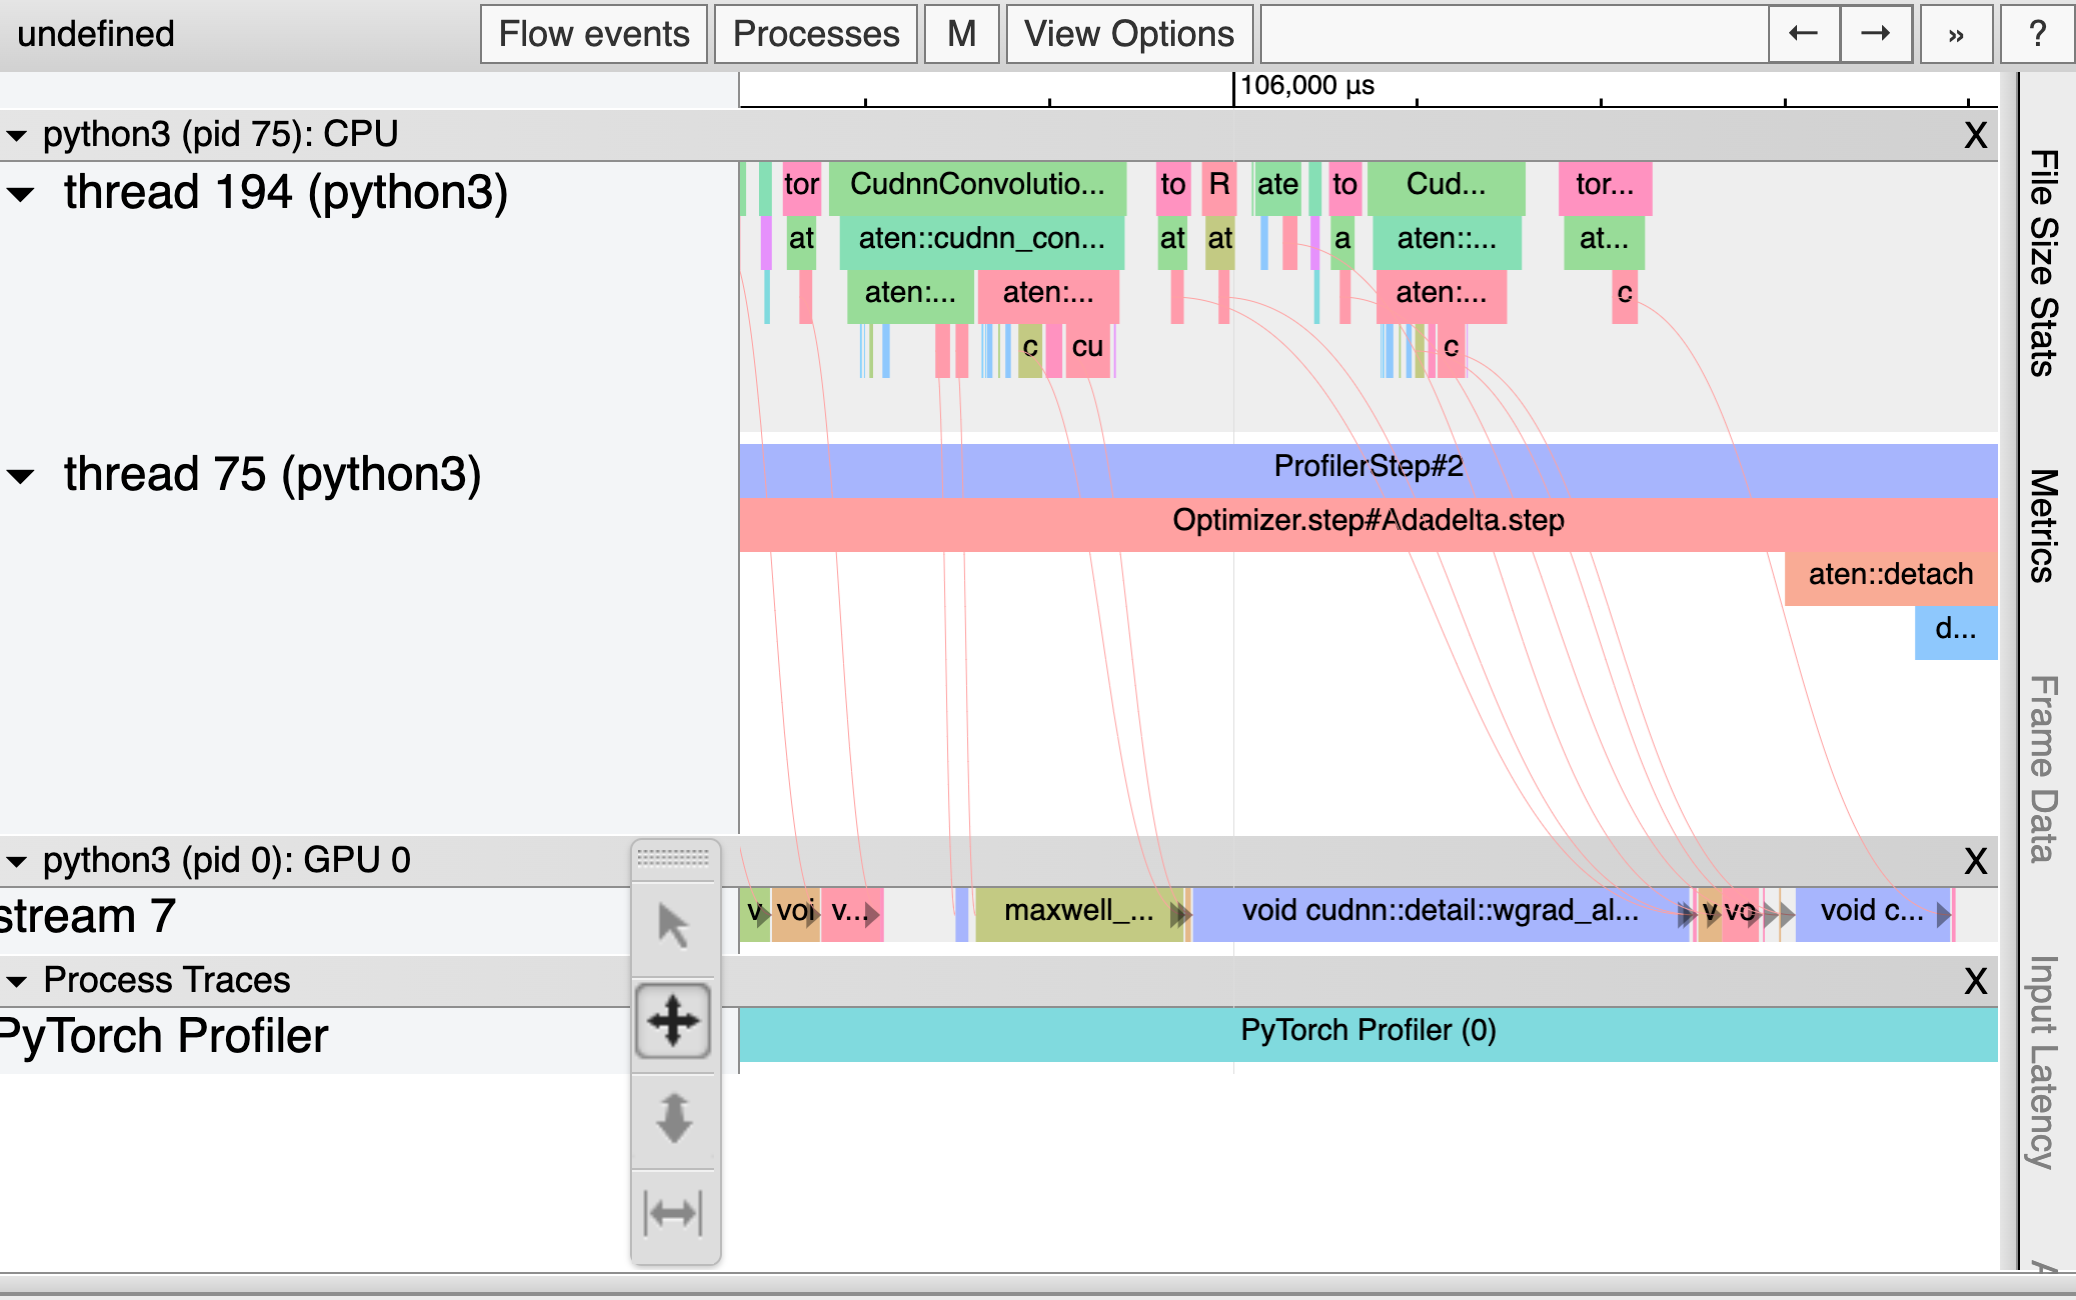
But now that Weights & Biases can render PyTorch traces using the Chrome Trace Viewer, I’ve decided to peel away the abstraction and find out just what’s been happening every time I call .forward and .backward. These traces indicate what work was being done and when in every process, thread, and stream on the CPU and GPU. By the time we’re done here, we’ll have a clear sense for why most of the optimization tips above work, plus the tools to make more informed choices about the performance of our PyTorch code.
Today I released a blog post using the PyTorch Trace Viewer tool to look inside the forward and backward passes of a simple neural network.
If the Trace Viewer is like a microscope for examining a DNN running on a CPU + GPU, this blog post is a public dissection – an examination with a pedagogical bent and an emphasis on immediately obvious and repeatable phenomena.
Read it here.