Answer
I'll be describing the circuit that gives rives to ON-center retinal ganglion cells (RGCs) and then tracing that up to visual cortex (skipping the thalamus, pace Sherman), where I'll describe how the output of this circuit is used to construct the simple cells of Hubel and Wiesel.
Retinal Circuitry
The basic retinal circuit appears below.
Green arrows represent sign-preserving synapses, while red arrows represent sign-inverting synapses.
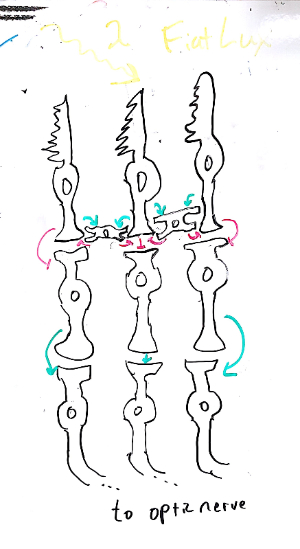
At the top are the photoreceptors, which transduce light into electrical activity. To the frustration of neuroscience undergraduates and medical students everywhere, there are two unintuitive things about photoreceptors. First, they are at the back of the retina, behind a bunch of light-scattering tissue. Second, their response to light is hyperpolarization, rather than depolarization, as we've come to expect from other systems.
These cells, unlike your standard vertebrate neurons but much like the neurons of invertebrates, do not fire action potentials, but rather continuously release neurotransmitter as an monotonic, continuous function of the membrane potential: an analog signal.
Therefore light causes a decrease in neurotransmitter release. These cells release glutamate, an excitatory neurotransmitter. Again to the chagrin of the mnemonically-minded, the bipolar cells express a metabotropic receptor for glutamate, sometimes called an APB receptor, sometimes called mGluR6 (see here for more details). This receptor happens to do the opposite of most glutamate receptors: it decreases cation conductance.
So the connection from photoreceptors to bipolar cells is sign-inverting. Excitation of a photoreceptor leads to inhibition of a bipolar cell. This leads us to the awkward conclusion that photoreceptors are inhibited by light. C'est la vie.
These bipolar cells, so named for their symmetric shape, synapse onto retinal ganglion cells. Those who prefer forests to trees breathe a sigh of relief: bipolar cells release glutamate onto retinal ganglion cells, which express good-old-fashioned AMPA receptors and fire classical action potentials. Sign, and sanity, are preserved.
One more cell type makes an appearance, all the way back up at the photoreceptor layer. These are the "horizontal cells", so named because they literally go against the grain, making connections perpendicular to the "vertical" circuit just described. Horizontal cells receive input from a neighborhood of photoreceptors, then synapse right back onto that same group. They are also coupled by gap junctions (not pictured) into a relatively synchronous, recurrent network.
This presentation of the retina is, in many ways, a simplification of the facts. First, we're implicitly only discussing one of the simplest retinal circuits: the cone-to-RGC pathway of the fovea, the highest acuity portion of the eye. In the periphery, multiple inputs converge on single ganglion cells, Furthermore, we've neglected starburst amacrine cells and the direction-selective ganglion cells they support. Glia, the perennially forgotten neural tissue, are neither seen nor heard.
We will ignore that complexity and focus in on our manageable chunk. We will answer the question of "what does this piece do?" and get a glimpse of why it does that.
An Aside on Analogies
It can be tempting to view the human sensory organs as a collection of wet and warm proxies for human technologies: the eye is a camera, the ears are microphones, etc. See the image below, posted (without attribution) in a forum discussion on perception by someone who seems to be adamantly opposed to understanding what qualia are.
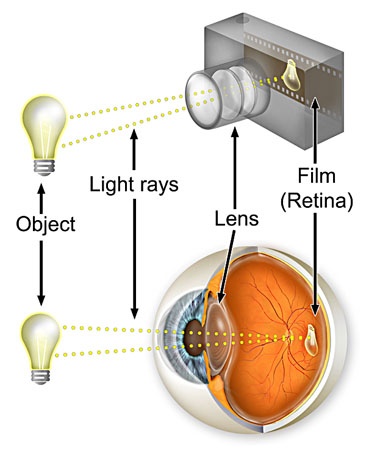
A false view of retinal function
Hopefully, the following description of the computation of the retina
will convince you that the operation of sensory systems
and human perception shares very little in common
with the operation of our artificial sensors.
The Retinal Computation
The net result of all of the circuitry described above is best understood if we take it apart into two pieces.
First, we have the response of the photoreceptor. Its membrane potential changes maximally when a light source is at some spot, and the magnitude of this deflection falls off rapidly and symmetrically as the light source moves away. This can be represented by a bell curve, or Gaussian function, and appears in green below. Note that we're only considering light moving on one dimension for now.
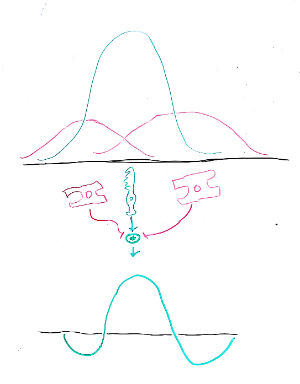
Second, we have the response of the nearby horizontal cells. These cells aren't directly light sensitive, but they pool the responses of nearby photoreceptors, taking a sort of "local average". This gives them a weaker and broader response. Their activity as a function of the position of the light source is shown in magenta.
A bipolar cell sees the difference of these two pieces, a photoreceptor acting in opposition to its local horizontal inhibitory network. This combination is represented by the green plus sign. The two magenta arrows have flat heads, the international sign for "inhibitory connection".
The mathematical result of subtracting the three signals appears in green below. This shape is well-known to aficionados of signal processing, especially image processing: it is the "Difference-of-Gaussians" or, more colorfully but perhaps politically-incorrectly, the "Mexican Hat Wavelet".
This curve might be more familiar to neuroscientists when plotted differently. Above, we used one axis for space and another for neural response. If we plot both spatial dimensions and use brightness to show the neural response, we get something more familiar:

I've pulled a little trick here and plotted response intensity as brightness, which happens to result in the optimal stimulus for this cell – what is called its "receptive field". The ease and naturalness of this visualization is one of the many reasons why studying vision is easier and more intuitive than, say, somatosensation. Man is a visual animal.
This 2-D Mexican Hat Wavelet (the sombrero now a bit harder to see) is moderately useful for image processing, as can be seen in the processed image of a panda below.

Though this image is less useful to the human eye, it is an excellent representation for computation, since it removes the correlations, or first-order statistical content, of the image, resulting in a more efficient code. This decreased redundancy allows for a more efficient transmission of information, which has potential evolutionary advantages.
Fans of Shannon's Incompressibility Theorem may protest that no lossless code can achieve this decrease in redundancy for every signal: for every signal that you win on, there is another on which your encoding does worse. They are correct: this process throws out some information. In information theory terms, it is a lossy transformation, like a jpg.
However, the eyes of animals, unlike the files on computers, are not expected to store arbitrary signals. Instead, they interact with a structured and consistent external environment, and so they can adapt to that structure to increase efficiency. Consider how much better you can remember, distinguish, and describe photographs than the static that appears on old analog TV sets.
One Step Further: Primary Visual Cortex
Many computations are performed in primary visual cortex (V1), but the best-studied is still that discovered by Hubel and Wiesel in the 60s.
The inputs of several ganglion cells converge on a single cortical neuron. This results in a receptive field for this neuron that is the sum of the underlying receptive fields.
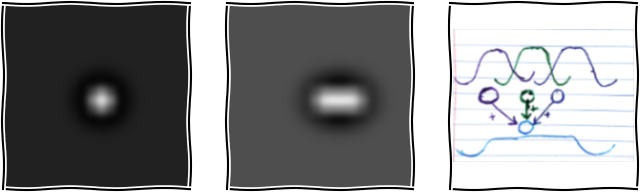
The left panel is our familiar RGC receptive field. The center panel shows the result of adding together three ON-center RGCs with slightly shifted centers.
The right panel is a schematic of the necessary neural circuit, simplified to the one-dimensional case. Three neurons, purple, green, and dark blue, have ON-center receptive fields, each with a slightly different center. They provide excitatory input (arrows) to the sky blue simple cell. Try drawing this cicruit yourself in two dimensions!
These so-called "simple cells" function as edge detectors: they are most activated by transitions between dark and light regions. Since edges are what delineate objects in a visual scene, it is intuitively obvious that edge detection is important,
Less obviously, the decomposition of an image into edges also reduces redunancy and removes correlations. In fact, many algorithms designed to automatically discover efficient representations of complex signals, like sparse coding and independent component analysis, converge on edge detection.
Check out this blog post to follow the circuit down another step.
A Coda on Complexity
The over-all effect of the above description may leave one feeling that we understand quite a bit about the function of the visual system. Unfortunately, this is not really the case. One glaring example: we've discussed static images, but eyes are evolved to process dynamically changing input.
So: as exciting as the progress of neuroscience is, we should always remember to be humble. Even for V1, one of the better-understood and simpler parts of the brain, we know what approximately 15% of the tissue is doing.
References
- Kandel and Schwartz, 5e. Low Level Visual Processing: The Retina. Ch 5-26.